
Table of contents
- 1 What is Netdania Charts? A Complete Guide for Forex Traders
- 1.1 Key Features of Netdania Charts
- 1.2 How to Use Netdania Charts Effectively
- 1.3 Netdania Forex Trading: Applying Charts to Your Strategies
- 1.4 Candlestick Patterns on Netdania
- 1.5 Maximizing Netdania Charts Efficiency
- 1.6 Common Mistakes on Netdania
- 1.7 Pros and Cons of Netdania Charts
- 1.8 Netdania Charting Tools: A Quick Overview
- 1.9 Netdania Charts vs. Other Platforms
- 1.10 Advanced Trading Strategies using Netdania
- 1.11 Netdania and Algorithmic Trading
- 1.12 Conclusion
- 1.13 Frequently Asked Questions-FAQ
What is Netdania Charts? A Complete Guide for Forex Traders
In the dynamic arena of Forex trading, the right tools can be a game-changer. Among numerous charting platforms, Netdania Charts distinguishes itself as a robust and adaptable choice for traders of all skill levels. Whether you’re an experienced trader or a novice, a good grasp and efficient application of Netdania Charts can greatly refine your trading approach and amplify your results.
Key Features of Netdania Charts
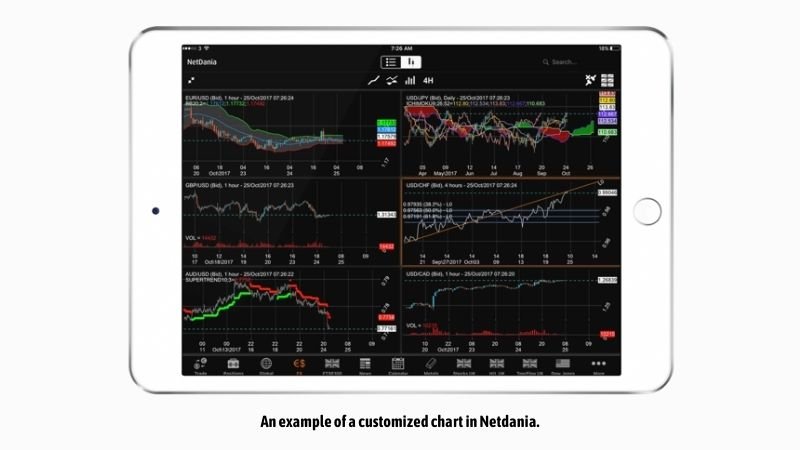
Netdania Charts is a platform offering real-time market data, interactive charts, and a wide array of analytical tools tailored for Forex trading and other financial markets. It is recognized for its user-friendliness, accessibility, and strong set of features. Here are the primary highlights:
- Real-time Data: Netdania delivers live price updates for numerous currency pairs, which guarantees you always have access to the most recent market information.
- Interactive Charts: The platform’s charts are highly adaptable, enabling traders to tailor the displays to fit their individual trading preferences and strategies.
- Extensive Indicator Library: From moving averages to RSI and MACD, Netdania provides a comprehensive collection of technical indicators that help to analyze market patterns and identify possible entry and exit points.
- Drawing Tools: Traders can use a variety of drawing tools to mark up charts, spot trends, and identify potential chart formations. This includes support and resistance lines, Fibonacci retracements, and more advanced options.
- Customization: The platform offers broad customization options, including chart themes, timeframes, and indicator adjustments, making it very adaptable to individual traders.
- Cross-Platform Availability: Netdania Charts can be accessed on desktop computers, tablets, and smartphones, giving traders the freedom to trade from anywhere.
- Alerts: Users are able to set price alerts, which allows you to react to market changes without constant monitoring.
How to Use Netdania Charts Effectively
Starting with Netdania Charts is very simple. Here’s a step-by-step guide to assist you in using the platform:
- Sign Up/Log In: Visit the Netdania website or mobile app to sign up for an account or log in if you are a returning user.
- Select Your Instrument: Pick the Forex pair you are interested in analyzing. You can search the symbol or browse through a comprehensive list of options.
- Customize Your Chart:
- Choose the preferred timeframe for your chart (e.g., 1-minute, 5-minute, hourly, daily, etc.).
- Select a chart style you prefer, for example, candlestick, bar, or line charts.
- Customize the chart themes and colors for better viewing experience.
- Add Indicators: Integrate relevant technical indicators from the drop-down menu. Start with a few core indicators and add more as you gain experience.
- Use Drawing Tools: Apply drawing tools to the charts to define trends, support/resistance levels, and potential chart patterns.
- Save Settings: Netdania has an option to save your chart settings and templates, so that you can quickly swap between different setups.
- Set Alerts: Configure price alerts to get notified when the price reaches your target levels.
Netdania Forex Trading: Applying Charts to Your Strategies
Netdania Charts proves to be exceptionally helpful in Forex trading by providing tools to aid various trading strategies. Here is how you can use them:
- Trend Following: Use indicators like moving averages to identify the direction of a trend and trade in its direction.
- Breakout Trading: Use drawing tools to spot support and resistance levels, and anticipate potential breakouts using candlestick patterns on Netdania.
- Range Trading: When prices are in a sideways range, identify key support and resistance levels to buy near support and sell near resistance using Netdania.
- Scalping: Use shorter timeframes and fast-reacting indicators to trade small price movements during volatile times.
- Swing Trading: Use longer timeframes and a combination of indicators to capture larger price swings.
For instance, when implementing a trend-following strategy, you may configure your chart with both 50-day and 200-day moving averages. A cross over of 50-day MA above the 200-day MA can signal a possible buy, whereas the reverse would indicate a potential sell.
Candlestick Patterns on Netdania
Grasping candlestick patterns is key for numerous traders, and Netdania Charts is the perfect platform for spotting and studying them. Some common patterns to look out for include:
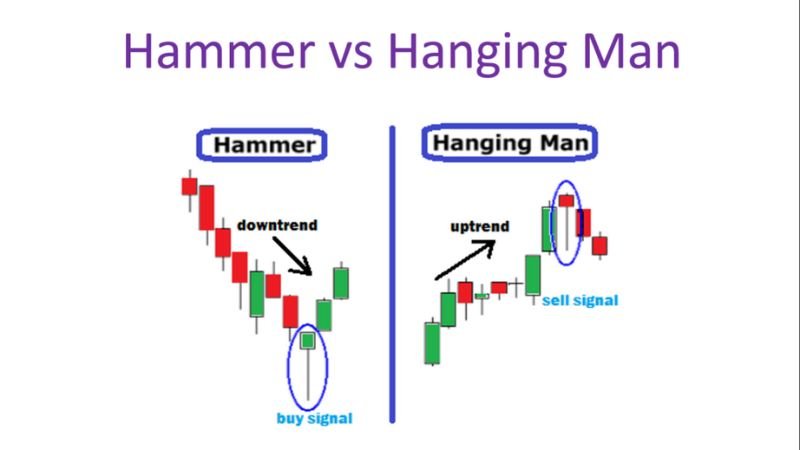
- Hammer and Hanging Man: These are reversal patterns, with the hammer appearing at the bottom of a downtrend and the hanging man appearing at the top of an uptrend.
- Bullish and Bearish Engulfing: These patterns signal possible reversals; the bullish engulfing indicates a potential shift from a downtrend and the bearish engulfing points to a shift from an uptrend.
- Morning and Evening Star: These are three-candlestick patterns which signal trend reversals, with the morning star occurring at the end of a downtrend and the evening star appearing at the end of an uptrend.
- Doji: This indicates indecision in the market. The Doji can be used together with other indicators to confirm a potential shift in trends.
Maximizing Netdania Charts Efficiency
To get the best out of Netdania Charts, here are some tips to maximize efficiency:
- Use Multiple Timeframes: Always analyze a currency pair across various timeframes (e.g., daily, 4-hour, 1-hour) for a complete understanding.
- Combine Indicators: Do not depend on a single indicator. Combine a few to get a well-rounded perspective on the market.
- Use Chart Templates: Save chart configurations as templates so that you can swap quickly between different strategies and market views.
- Practice: Spend time experimenting with the platform to learn its features and customize it to your personal style.
- Stay Updated: The Forex market is very dynamic and changes rapidly, therefore update your knowledge regularly.
Common Mistakes on Netdania
Even though Netdania Charts is simple to use, traders can still make mistakes. Here are a few common mistakes to avoid:
- Overloading Charts: Using too many indicators can make the chart cluttered and hard to understand.
- Ignoring Fundamentals: While technical analysis is important, it’s also essential to monitor fundamentals that may affect the markets.
- Not Using Stop-Loss Orders: Relying solely on analysis without using stop-loss orders can lead to substantial losses.
- Emotional Trading: Let your strategies guide trading decisions rather than emotions like fear or greed.
- Not Keeping Charts Updated: Regularly update and review charts as market conditions evolve.
Pros and Cons of Netdania Charts
Like other platforms, Netdania Charts has its advantages and disadvantages. Here’s a summary:
Pros:
- Free Access: Basic functionality of Netdania is free, making it affordable for all traders.
- Cross-Platform Availability: Accessible on mobile, tablets, and desktop for trading on the go.
- User-Friendly Interface: Easy navigation, suitable for beginners.
- Extensive Range of Tools: Provides a comprehensive suite of charting and analysis tools.
Cons:
- Limited Advanced Features: May lack some advanced capabilities found in more premium platforms.
- Data Accuracy: While real-time data is typically precise, it is good to compare against different sources to ensure accuracy.
Netdania Charting Tools: A Quick Overview
Here are some key charting tools you’ll find on Netdania:
- Trendlines: Used to determine the general direction of market trends.
- Fibonacci Retracements: Helps in identifying potential support and resistance levels using Fibonacci retracements.
- Moving Averages: Smooth out price data to better visualize trends.
- Relative Strength Index (RSI): Gauge the velocity and change in price movements to find overbought or oversold conditions.
- Moving Average Convergence Divergence (MACD): Use MACD to identify changes in the strength, direction, momentum, and duration of trends.
For instance, you can draw trend lines on a chart to see the direction of a trend, then use Fibonacci retracements to locate potential support and resistance levels where the price might make a turn.
Netdania Charts vs. Other Platforms
To provide a more comprehensive understanding, let’s compare Netdania Charts with some other popular trading platforms.
| Feature | Netdania Charts | TradingView | MetaTrader 4 (MT4) |
|---|---|---|---|
| Cost | Free basic version, premium options available | Free basic version, paid Pro versions | Free via brokers, can include fees with premium addons |
| Ease of Use | Very user-friendly, suitable for beginners | User-friendly with a modern UI, good for all experience levels | Slightly complex interface, ideal for experienced traders |
| Charting Tools | Comprehensive charting tools, many technical indicators and drawing tools | Extensive charting tools, large selection of indicators and unique drawing tools | Standard charting tools, many community developed indicators |
| Real-Time Data | Real-time data from multiple sources | Real-time data, integrates with many brokers | Real-time data from brokers |
| Customization | Good level of customization, suitable for personal preferences | Highly customizable, with many chart style options, and layout preferences | Limited customisation options |
| Mobile App | Available on both iOS and Android devices | Available on both iOS and Android devices | Available on both iOS and Android devices |
| Alerts | Configurable price alerts | Highly customisable alerts | Basic alerts available |
| Community Features | Limited community features | Strong community features with sharing and discussion forums | Limited community features |
This table provides a high-level overview. The best platform for you will depend on your specific trading needs, style, and priorities.
Advanced Trading Strategies using Netdania
Beyond the basic strategies, Netdania Charts can also be used for more advanced techniques. Here are a few of these:
- Harmonic Patterns: Identify harmonic patterns like Gartley, Butterfly, or Bat patterns. These patterns can indicate potential reversal zones.
- Elliott Wave Theory: Use Netdania’s charting tools to analyze potential Elliott wave patterns. This helps to predict market psychology.
- Ichimoku Cloud: Use the Ichimoku Cloud indicator on Netdania to identify potential support and resistance zones, momentum, and trend direction.
- Order Blocks: Locate areas where institutional buying or selling pressure is strong, using the price action and volume.
- Volume Profile: Analyze the areas of higher volume and potential support and resistance levels.
Netdania and Algorithmic Trading
While Netdania does not directly support algorithmic trading, the platform’s data and charts can be used in conjunction with algorithmic trading platforms. You can:
- Use Real-Time Data: Pull real-time data from Netdania to use in your algorithmic strategies.
- Analyze Chart Patterns: Use historical charts from Netdania to identify patterns that can be automated using algorithms.
- Develop Indicators: Create custom indicators based on your analysis on Netdania and use them in an algo-trading platform.
Conclusion
Netdania Charts is an invaluable asset for anyone involved in Forex trading. Its intuitive interface, wide array of tools, and accessibility make it a great choice for traders of all experience levels. By understanding how to use Netdania charting tools, avoiding common errors, and implementing effective trading strategies, you can significantly improve your trading outcomes. So, start exploring Netdania Charts today and take your Forex trading to the next level!
Ready to elevate your forex trading? Try Netdania Charts Now!


Pingback: Navigating the World of Forex Brokers: A Comprehensive Guide - CoinFxPro
Pingback: What is Binance App? A Comprehensive Guide CoinFxPro Trading Tools
Pingback: How to Start Forex Trading: A Beginner's Guide CoinFxPro
Pingback: Mastering Forex: A Guide to Currency Pairs CoinFxPro Forex