
Table of contents
- 1 How Bubblemaps Crypto Tools Revolutionize Blockchain Analytics
- 1.1 I. Introduction
- 1.2 II. Understanding Bubblemaps in Crypto
- 1.3 III. Benefits of Using Bubblemaps for Crypto Analysis
- 1.4 IV. Use Cases of Bubblemaps in the Crypto Ecosystem
- 1.5 V. Comparison of Bubblemaps with Other Crypto Tools
- 1.6 VI. Challenges and Limitations of Bubblemaps
- 1.7 VII. Future of Bubblemaps in Crypto Analytics
- 1.8 VIII. How to Use Bubblemaps Effectively
- 1.9 IX. Top Bubblemaps Tools and Platforms
- 1.10 X. Conclusion
- 1.11 XI. FAQ Section
How Bubblemaps Crypto Tools Revolutionize Blockchain Analytics
The world of cryptocurrency is a fascinating, yet complex, landscape. Behind the flashy headlines and volatile price swings lies a vast network of transactions, wallets, and tokens. Navigating this intricate web can be daunting, even for seasoned investors. This is where bubblemaps crypto tools step in, offering a visual gateway to understanding the often-opaque world of blockchain.
I. Introduction
What is Bubblemaps Crypto?
Bubblemaps, in the context of crypto, refer to a visual representation of blockchain data using bubble charts. These maps illustrate the relationships between different cryptocurrency wallets, transactions, and token movements. Instead of raw data, which can be overwhelming, bubblemaps provide an intuitive way to grasp the complex dynamics of the crypto ecosystem.
Visualization tools are crucial because they transform complex data into understandable formats. The blockchain is a vast, interconnected ledger, and without the right tools, making sense of it is nearly impossible. According to a recent study by Chainalysis, in 2023 alone, illicit cryptocurrency transactions reached approximately $24.2 billion. This highlights the need for tools that can quickly identify potentially nefarious activity. Tools like bubblemaps make it easier to track these large sums of money.
The Growing Need for Blockchain Transparency
Transparency is the cornerstone of blockchain technology, yet the sheer volume of transactions can make it difficult to trace activities. Tracking individual transactions and their connections often proves to be a challenge, especially as the ecosystem grows. This is where bubblemaps crypto come into play, by simplifying this complex data into a visual format.
Traditional blockchain explorers present information in lists and tables which require a lot of technical knowledge to decipher. Bubblemaps tools transform this raw information into a visual and user-friendly format. This helps us understand things such as:
- The movement of tokens between wallets.
- The distribution of a token amongst holders.
- The interactions within decentralized finance (DeFi) protocols.
II. Understanding Bubblemaps in Crypto
What are Bubblemaps?
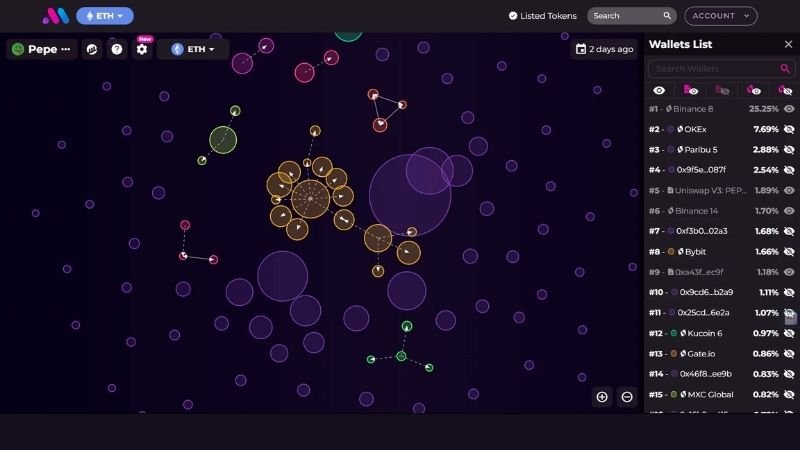
Bubblemaps in the context of crypto analysis are interactive bubble charts used to represent wallets, transactions, and token ownership within a blockchain network. Each bubble represents a wallet, and its size corresponds to the amount of tokens or assets it holds. Connections between bubbles illustrate the flow of funds from one wallet to another.
Key Features of Bubblemaps:
- Bubble Size: Represents the number of tokens held in a wallet. The larger the bubble, the more tokens the wallet controls.
- Color Coding: Indicates different characteristics, like whale wallets (large holders), exchange wallets, or smart contracts. This visual differentiation helps users quickly identify key players within the network.
- Connections (Lines/Arrows): Visualize the flow of funds between wallets. The thickness of lines or arrows can represent the transaction size.
- Interactive Features: Allow users to zoom in, pan, and explore the network. Many platforms also offer filters to highlight specific types of transactions or wallets.
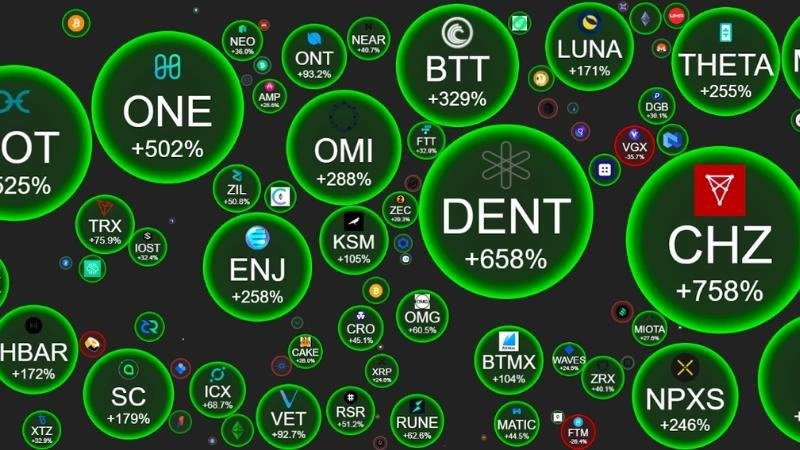
A crypto bubblemaps
How Bubblemaps Work
Bubblemaps tools work by taking data from blockchain explorers and transforming that data into a visual chart. This process involves:
- Data Collection: The system pulls transaction records, wallet balances, and token distributions from the blockchain. This data is publicly available but can be complex to interpret.
- Data Processing: This raw data is then analyzed to identify key information, such as the relationship between wallets. Algorithms identify patterns, transaction flows, and large movements of funds.
- Visualization: The processed data is used to create a bubble chart. The platform uses graphics libraries to render the data in an easy to understand format.
The platform also offers real time visualization of token distributions and movements. This is not static information. As transactions are recorded on the blockchain, the bubblemaps tool will update the chart in real time, allowing users to have an up to the minute view of blockchain activity. This real-time aspect is crucial for spotting emerging patterns, such as a potential token dump or whale activity.
Types of Data Represented in Bubblemaps
Bubblemaps can show a variety of data points including:
- Wallet Clusters: Groups of wallets linked by transactions, which can help identify connected entities. For example, a cluster of wallets with a high degree of interaction might belong to a single user or a group of affiliated users.
- Transaction Flows: The direction and volume of transactions between wallets. This can help identify market trends or suspicious activity.
- Token Distributions: The concentration of tokens among different wallets. This can help users understand if a token is widely distributed or if it’s primarily held by a small group of whales, which may indicate a higher risk.
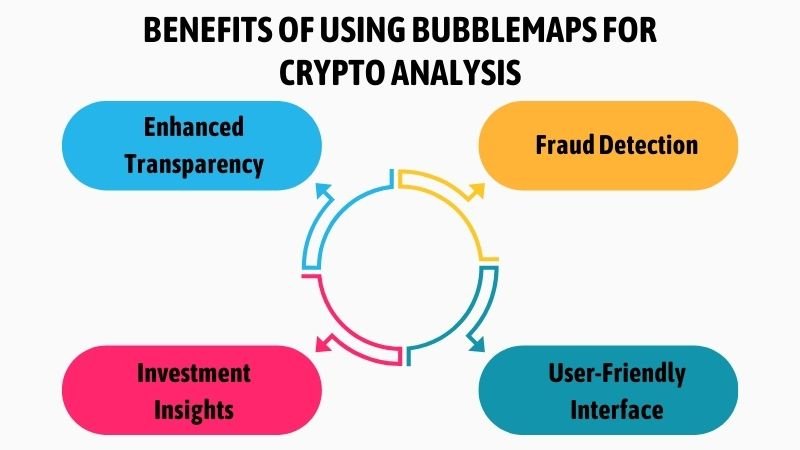
III. Benefits of Using Bubblemaps for Crypto Analysis
Enhanced Transparency
By visualizing complex transaction patterns, bubblemaps can help increase blockchain transparency. Users can track the flow of funds and identify entities responsible for large transactions, also known as whale wallets. For example, an investor might use a bubblemaps to identify if a large amount of a token is held by a small number of wallets, which may be a cause for concern. This granular level of insight was previously not accessible to the average investor.
According to a report by the World Economic Forum, blockchain technology has the potential to increase transparency and accountability across various sectors. Bubblemaps tools take advantage of this potential and allow investors to better understand the markets they are in.
Fraud Detection
Bubblemaps are excellent at detecting suspicious activities that might not be immediately obvious from raw blockchain data. For example:
- Rug Pulls: A sudden movement of tokens from a project to the developers may indicate a pending rug pull. A ‘rug pull’ is a scam where the developers of a cryptocurrency project abandon it after raising substantial funds. Bubblemaps can show these token movements in real time. You can also read more about scams such as the bait and switch scam.
- Pump and Dump Schemes: Unusually large transactions followed by an immediate decrease in liquidity can indicate a potential pump and dump scheme. The visual representation of this activity can be easily identified and the user can make a better decision about what to do.
- Wash Trading: Bubblemaps can also help identify wash trading where a trader buys and sells the same asset to artificially inflate its volume.
Investment Insights
Bubblemaps are not just useful for identifying problems. They can also be used as an investment tool. By analyzing a token’s distribution, an investor can determine:
- Whether the token is held by a few large holders (which may be risky) or by a large community. If the majority of tokens are held by a few wallets, this could mean that the price could be manipulated by those whales, which may make the token riskier for new investors.
- The trading activity of a project’s tokens. High trading volume from a small number of wallets could signify suspicious activity.
- The token distribution and activities within DeFi projects. Understanding how tokens are used within DeFi protocols can help investors make informed decisions. You may also want to learn more about governance tokens within these projects.
User-Friendly Interface
One of the major advantages of bubblemaps tools is their ease of use. They transform complicated information into a user-friendly visualization. This is beneficial for users without a deep technical understanding of blockchain data. This can help democratize on-chain analysis. With easy to understand charts, even new crypto investors can take advantage of the analysis tools. If you are new to crypto, you may also want to learn about what is cryptocurrency before using bubblemaps.
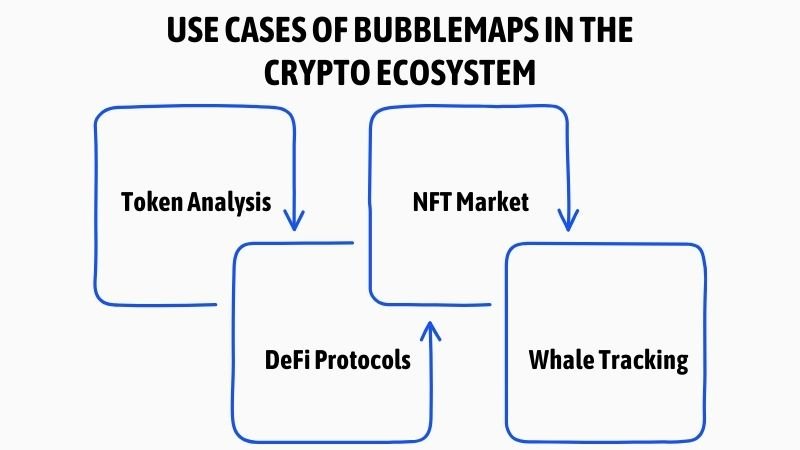
IV. Use Cases of Bubblemaps in the Crypto Ecosystem
Token Analysis
Bubblemaps are very useful in analyzing token distributions and strategies. For example:
- Token Hoarding: Identifying whether a few wallets are holding large amounts of a token. This insight can reveal the potential for price manipulation or market instability.
- Unfair Allocations: Identifying if a token distribution favors specific groups over others. This could indicate a potential lack of transparency in the project’s tokenomics.
DeFi Protocols
Bubblemaps can be used to analyze the movements of funds within DeFi protocols, such as:
- Liquidity Pools: Tracking how funds are flowing in and out of liquidity pools. This can help in identifying trends and possible impermanent loss risks.
- Staking Behaviors: Identifying wallets involved in staking and their activity. This can help investors assess the stability and engagement level of the protocol. Also see NFT staking.
NFT Market
The visual nature of bubblemaps makes them useful for tracking activities within the NFT market. For example:
- Wallet Activities: Identifying wallets that are actively involved in buying and selling NFTs. This can highlight key players in the NFT ecosystem. You may also be interested in xNFTs.
- Insider Trading: Detecting potential insider trading by monitoring the early transactions of an NFT release. Unusual patterns in early transactions can indicate possible insider information being used. You may also want to check NFT floor prices.
Whale Tracking
Large wallets, often referred to as ‘whales’, can have a large influence on market behavior. Bubblemaps can help in tracking these whales by:
- Identifying Influential Wallets: Easily spotting wallets with the largest token holdings. This insight is useful in understanding which entities can significantly impact market prices.
- Tracking Trading Activities: Observing their transaction patterns. Monitoring the activity of whales can give investors insights into their strategy.
V. Comparison of Bubblemaps with Other Crypto Tools
Traditional Blockchain Explorers vs. Bubblemaps
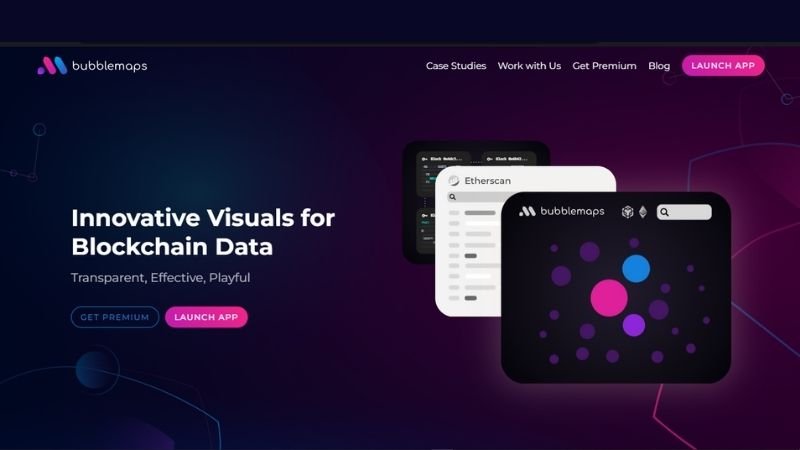
Traditional blockchain explorers like Etherscan or Blockchain.com display raw transaction data. While these are comprehensive, they can be overwhelming for many users. On the other hand, bubblemaps provide a visual summary, highlighting important relationships and patterns more quickly.
Visual data is more intuitive than raw data because:
- It is easier to quickly identify patterns and relationships. Human brains are more adept at identifying visual patterns than tables of numbers.
- It can be interpreted faster than a large set of numbers. Visual data provides a much faster overview than raw data.
- It can be more accessible to people without a deep technical background. Visual data democratizes on-chain analysis and allows more people to understand blockchain activity.
Integration with Other Tools
Many bubblemaps platforms are designed to work with other data analytic tools such as Glassnode and Nansen. This integration can enhance research by providing:
- Layered Insights: Combining visual data with advanced analytics. This can result in more comprehensive and accurate analysis of blockchain data.
- More Complete Information: Providing a holistic view of the crypto ecosystem. Integration with other tools allows for cross-referencing data and further research. You can also read reviews of other tools such as ChartPrime, TradingView, CoinStats, Koinly, and CoinTracker.
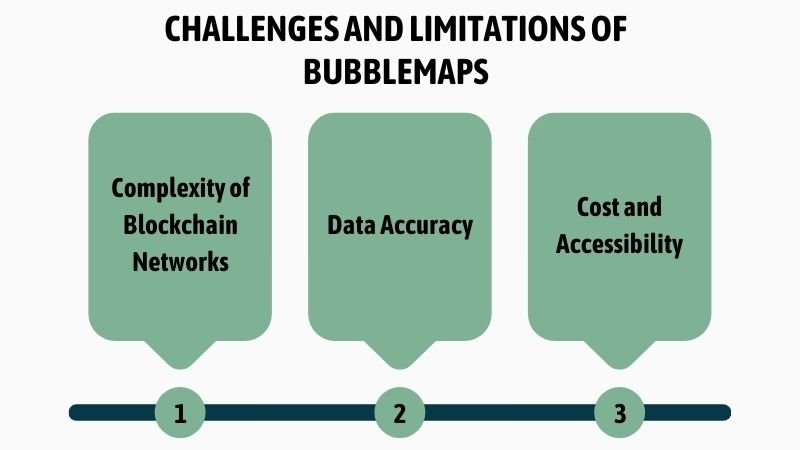
VI. Challenges and Limitations of Bubblemaps
Complexity of Blockchain Networks
Mapping highly fragmented blockchains can present a challenge. Bubblemaps platforms struggle with accurately visualizing complex transactions across multiple chains. For example, tracking activity across several different L2 scaling solutions at once is difficult. This limitation can lead to an incomplete understanding of the activity across the ecosystem.
Data Accuracy
The accuracy of a bubblemaps tool relies on the reliability of the underlying blockchain data. Sometimes, identifying off chain transactions or the actors involved can prove to be difficult. Moreover, the use of different wallet types and the potential for misinterpretation of data can result in inaccurate visualizations. This can lead to flawed conclusions based on visual data.
Cost and Accessibility
Many of the more advanced bubblemaps tools and platforms come with a subscription fee. This can create a potential barrier to entry for smaller investors and researchers. While there are some free tools, they may not be as comprehensive or accurate as paid ones. This can limit the ability of the small investors to compete with larger players in the crypto market.
VII. Future of Bubblemaps in Crypto Analytics
Advancements in Visualization Technology
Bubblemaps tools are evolving rapidly, incorporating:
- AI and Machine Learning: Tools are increasingly using AI to provide deeper insights and predict future trends. These include detecting hidden patterns, identifying suspicious activities, and predicting price movements. You may also want to learn more about AI wallets.
- Enhanced Usability: Platforms are becoming more user-friendly, making them accessible to both retail and institutional investors. This involves simplifying the interface and providing more tutorials and documentation.
Expansion to Multi-Chain Analysis
The future of bubblemaps includes the expansion to support networks beyond just Ethereum and Bitcoin. As the crypto market becomes more multi-chain, the ability to track transactions across many networks will become critical for data analysis. This will allow for a more comprehensive understanding of the crypto ecosystem. According to CoinDesk, as of 2024, there are over 100 major layer-1 blockchains.
Role in Regulatory Compliance
As regulatory bodies across the world continue to examine crypto assets more carefully, bubblemaps tools can play an important role by:
- Helping regulators monitor on-chain activities and implement compliance strategies. Visualizing transaction data makes it easier to monitor suspicious activities.
- Contributing to a global crypto transparency and creating a more secure market. Greater transparency in the market can lead to more stability in the long term.
VIII. How to Use Bubblemaps Effectively
Getting Started with Bubblemaps
To get started with bubblemaps, users should:
- Choose the Right Platform: Select a tool that aligns with their needs and provides the level of analysis they require. Some tools may be better for specific tasks such as NFT analysis.
- Understand Basic Functionalities: Familiarize themselves with navigation, features, and key metrics. Users should make sure that they understand all the features before attempting to analyze the data.
Analyzing Data for Investment Decisions
When using bubblemaps, investors should look for:
- Red Flags: Identifying potential scams by looking for suspicious patterns. Look for patterns of large token transfers from the project to other wallets as this may be a sign of a rug pull.
- Project Legitimacy: Validating a project by understanding the token distribution and usage. This means not just looking at token ownership, but also the pattern of token usage within the project.
Practical Tips for Beginners
Beginners should keep these practical tips in mind when using bubblemaps:
- Avoid Over-analysis: Combining visual data with other fundamental research. Visual data should always be combined with other forms of research to gain a complete understanding. You may also want to learn about what is a trading strategy.
- Combine Data Sources: Correlating data from bubblemaps with other sources for more accuracy. Using multiple tools and data sources will provide a more accurate picture of the crypto market. You may also want to learn about how to trade cryptocurrency, or how to buy cryptocurrency. Also consider getting a crypto wallet.
IX. Top Bubblemaps Tools and Platforms
Overview of Popular Platforms
Several bubblemaps platforms are available in the market. Some of the more popular ones include:
- Nansen: A comprehensive platform with in-depth analysis and a range of features. It offers a wide range of on-chain data and analysis tools.
- Arkham Intelligence: Known for its advanced entity analysis and on-chain data. It allows users to track individual entities and their movement in the blockchain.
- Dune Analytics: A powerful tool for data analytics, often used by experienced researchers. It is particularly useful for creating custom dashboards and reports.
When choosing the right tool, you should keep these factors in mind:
- Ease of Use: How intuitive is the interface and does it suit your skill level. It is important to choose a tool that you can easily navigate.
- Cost: What are the subscription fees and are they reasonable for you. Different platforms offer a variety of subscription levels to accommodate various budgets.
- Supported Networks: Does the platform support the blockchains and tokens that are important for you. Make sure the platform supports the chains and projects that you need to analyze. You may also want to explore what altcoins are supported.
Case Studies
To give you a sense of the usefulness of bubblemaps, here are some practical examples:
- Analyzing the distribution of a newly released token to gauge whether a token is held by a large community or a few large whales. If most of the tokens are held by a few wallets, this could be a cause for concern.
- Identifying a potential rug pull of a DeFi project by monitoring the transfer of the majority of the funds from the project to a different wallet. This activity can be easy to identify with visual data.
X. Conclusion
Summary of Key Points
Bubblemaps are a very powerful tool that can help us understand and navigate the world of cryptocurrencies. They bring greater transparency to the market and can be used for a variety of purposes including investment analysis and fraud detection. By visualizing complex data, these tools allow both sophisticated analysts and average crypto enthusiasts to better understand what is happening in the crypto space.
Final Thoughts
Bubblemaps tools are continuing to develop and have the potential to revolutionize how we approach blockchain analysis. Users are encouraged to explore these tools and integrate them into their investment and research strategies. As the crypto market evolves, bubblemaps will likely become even more valuable as a way of navigating and understanding the complex ecosystem.


Pingback: What is Kraken Crypto: A Comprehensive Guide CoinFxPro Crypto Tools
Pingback: What is Binance App? A Comprehensive Guide CoinFxPro Trading Tools